When to buy and sell construction equipment on auction and resale. Plus: Construction equipment resale and auction values in October.
December 10, 2021

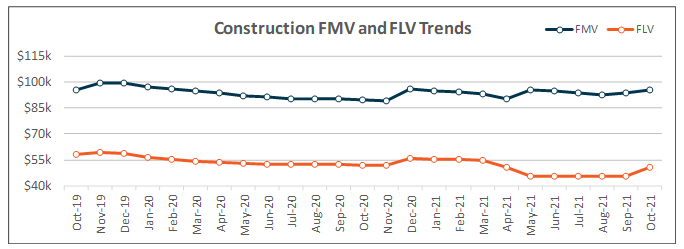
Continuing the trend we have seen for several months now, activity for construction equipment in October 2021 was down as average equipment age was generally up. On both the resale and auction channels, activity declined more than 30% compared to the same month last year. FMVs nudged up 1.9% from September to October 2021 and FLVs jumped 12.2%, as we continue to see strong demand and lack of new and used equipment inventory.

(Resale activity based on listings; Auction activity based on sales results.)
Equipment Pricing Seasonality Across Channels
As we close out 2021 and begin to focus our attention to 2022, strategic planning, budgeting, and fleet management may be top of mind. Equipment buying, in particular, may be a bit more in focus if you have had trouble this year securing new equipment and might be anticipating additional work next year with the recent passage of the $1 trillion infrastructure bill.
It was with this in mind that we decided to center this month’s Market Report on seasonality of used equipment pricing. Specifically, we wanted to see what seasonality looked like pre-pandemic and understand what it may point to for the year-to-come. We’ve broken this seasonality out by channel—both resale and auction—and have identified interesting and actionable differences that will help you make more strategic decisions about when to buy and when to sell.
Throughout this report we are calculating seasonality in a straightforward way: how far a particular month’s average pricing was from the average for the year. So, for example, January 2017 average pricing is compared against the overall 2017 average to determine the percentage difference. In this way we can compare multiple years’ worth of pricing seasonality without being bogged down by how much overall prices themselves were increasing or decreasing from year to year.
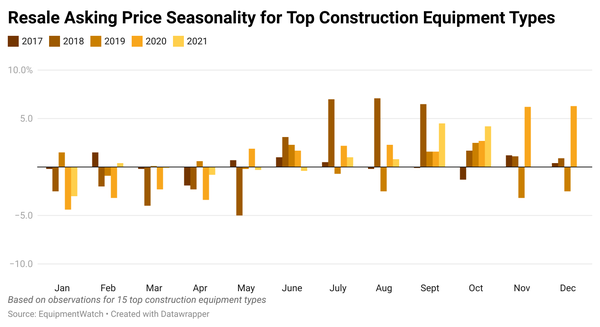
The chart below shows resale asking price seasonality for a composite of 15 top construction equipment types. Data for 58 months—from January 2017 through October 2021—are represented. For 2017 through 2020, each month’s average asking price is compared to the year’s average price and the percentage above or below is shown. For 2021, average pricing for the full year is based on data from January through October.
The first thing that stands out is that pricing tends to be lower from January through May and higher from June through December. The second is that these trends are just that—trends—not hard and fast rules, as some years have pricing going counter to what we’d expect. Lastly, we can see the range for these deviations are between -5.0% and 7.1%. As we will see, this range is much more muted compared to variations in auction pricing.
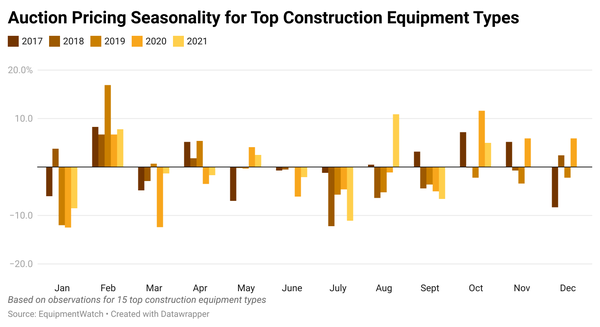
On the next page, we can see the pricing seasonality for the auction channel. As mentioned, pricing appears to be much more volatile compared to what we see on the resale channel. Here we see the range widen by about double, from -12.5% to 16.9%. One key reason that may explain this stark contrast in range is the time constraints of auction compared to resale. By its nature, auctions are timed events and to a large degree items for sale are going to be sold within a certain window. Contrast that with resale listings, which have the benefit of time and sellers may not be as concerned with adjusting an asking price.
Continuing our examination of the auction seasonality chart, we can see that auction pricing is decidedly stronger in February. This makes an intuitive sense, as February is a big time for auctions with lots of excitement around mega auctions at that time. However, it is not usually the overall highest activity of the year; that is typically in December. The timing of the February auctions in particular—as contractors are gearing up for projects kicking off in the spring—paired with the industry hype surrounding them, seem to help pricing spike compared to other months of the year. Relative pricing in December, on the other hand, is more varied and inconsistent from year-to-year.
Pricing in January and March, the months leading up to and just after the big February auction time, tend to have lower average pricing, although this has not been entirely consistent over the five years analyzed. July did have consistently lower pricing across 2017 to 2021.
Of course, it would be great to time buying when pricing is typically low and selling when pricing is typically elevated, but the reality may be that timing is dictated by more practical considerations like project schedules and internal budgeting constraints. However, knowing when and how pricing tends to spike and fall throughout a typical year can help you prepare and try to leverage seasonality for your advantage.
These numbers are based on the top 15 construction equipment types in aggregate, but our Market Report this month breaks this down further for the top equipment types in construction, lift, and agriculture.
Seasonality: A Closer Look at Crawler-Mounted Hydraulic Excavators
When diving into pricing seasonality, crawler mounted hydraulic excavators are nearly always at the top of the list among construction equipment. For instance, in October 2021 this equipment type accounted for 19.2% of our resale observations and 13.8% of our auction observations.
Pricing seasonality specific to crawler mounted hydraulic excavators is quite similar to what we saw for the wider range of construction equipment we discussed earlier in this report. Pricing seasonality for the resale channel is shown below, while auction pricing seasonality follows further down the page.
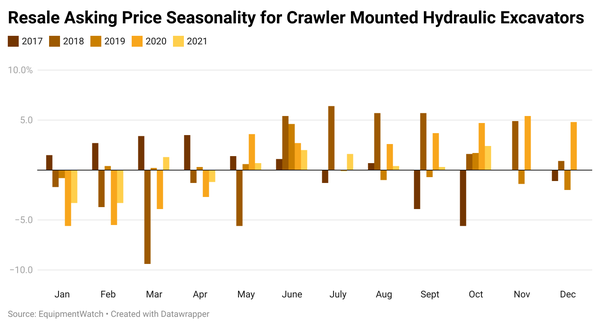
As with the overall construction equipment seasonality discussed earlier in this report, variance in pricing was more pronounced for the crawler mounted hydraulic excavators at auction compared to their resale list prices. Over the 58 months analyzed, deviation from the yearly average ranged from -9.4% to 6.4% on the resale channel but was about five times higher on auction, ranging from between -38.2% and 42.2%.
Looking at resale seasonality, January through May tend to have lower-than-average asking prices while June through December tend to have higher-than-average asking prices. 2017 in particular had several months counter to this trend, but overall, that appears to describe the seasonality related to the channel.
On the auction side, February was the most consistent month across all five years, with above-average prices each February. This also aligns with mega-auction scheduling and the industry hype surrounding them, along with being toward the beginning of the year when contractors are gearing up for project kick-offs.
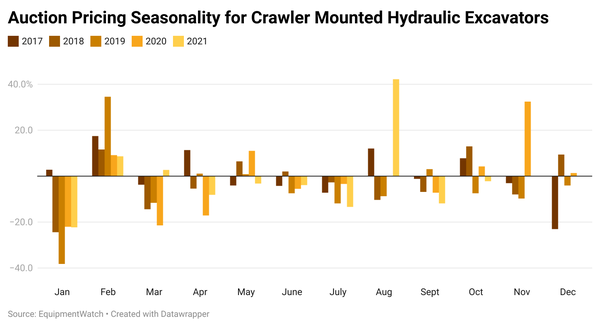
July was the most consistent month for lower-than-average auction pricing, seeing this lower price point in all five years. While less consistent throughout the years analyzed, January and March saw bigger negative spikes in their average pricing across four of the five years. This is likely due to their proximity to the February boom.
The two months not yet recorded in this analysis are November and December 2021. On the resale channel, pricing seasonality for these two months appears to be very mixed over the years. Average pricing was well above-average in November 2018, November 2020, and December 2020, but otherwise deviation from the annual average was more flat or negative. Looking at previous Novembers on the auction channel, we can see that they typically have slightly lower-than-average pricing, except for in 2020 when pricing was 32.5% above the 2020 average. Decembers appear to be more mixed, with both 2017 and 2019 showing lower-than-average pricing and 2018 and 2020 showing slightly above-average pricing.
*Fair Market Value (FMV) is the value of an asset sold to a single buyer under no compulsion. Forced Liquidation Value (FLV) is the value of an asset sold at a properly advertised and conducted auction in which the seller is under compulsion to sell on an as-is, where-is basis as of a specific date.
This article is brought to you through a collaboration between EquipmentWatch and World of Concrete 360. The EquipmentWatch Market Report is a monthly resource for the construction, lift/access, and agriculture industries to help equipment managers make better-informed decisions by leveraging key equipment values, market activity, age, and usage metrics. For more information about EquipmentWatch’s methodology and data, and to learn more about what it has to offer contractors, click here.
About the Author(s)
You May Also Like

